Search This Blog

Thursday, October 18, 2012

Cost Allocation of SPS Service Using Cooperative Game Theory


Power systems planning and operations are usually defined by N-1 criterion. This means that in an event of a single contingency, no remaining connected transmission elements will be thermally overloaded, no bus voltage will be outside of acceptable limits, no system interface limit is violated, and system stability is maintained.

Special Protection Systems or SPS are widely utilized for increasing power transfer in transmission systems at the same time respecting security constraints [1]. SPS applications usually are generation rejection schemes (GRS), line/transformer transfer tripping and load shedding. GRS are designed to mitigate overloading of a transmission line or lines after an N-1 contingency near the vicinity of a generating plant or are employed to arrest increasing dynamic oscillation which may lead to unstable system conditions. Without the GRS, generation output is curtailed to satisfy the N-1 security criterion. With the GRS, the output of the generation is increased thereby increasing power transfer. Further, GRS also mitigates or delays the possibility of transmission expansion or investment due to transmission capacity constraints.

In a locational marginal pricing based electricity market, curtailment of generation (without GRS), specifically of a cheap generation due to the security N-1 criterion can be considered as transmission congestion. Transmission capacity limitations impede the generation output thereby decreasing the profit opportunity of the generation company (GenCo).  If a GRS is installed for this GenCo, the output of the GenCo is increased and thus there is a clear benefit for the GenCo in terms of profit. When transfer capability is limited, without GRS, the profit of a transmission owner (TO) is decreased due to less power wheeling charges. With the GRS, wheeling charges increase as a consequence of the added power transfer. This premise is the same with the electricity system and market administrator, called independent system operator (ISO), since the ISO charges for cost-based services including scheduling, system control and dispatch.  For the demand side, when generation output is curtailed due to congestion, without GRS, the resulting nodal prices at the demand’s location maybe higher than when a GRS is in place to increase generation output from a cheap generation.

GRS installations have embedded cost and actual service cost [3]. Since electricity market participants have various benefits in having a GRS installation, the cost of the SPS/GRS service must be allocated among the participants. Cooperative game theory [4-5] can be utilized in allocating fair cost on the beneficiaries of the SPS service.

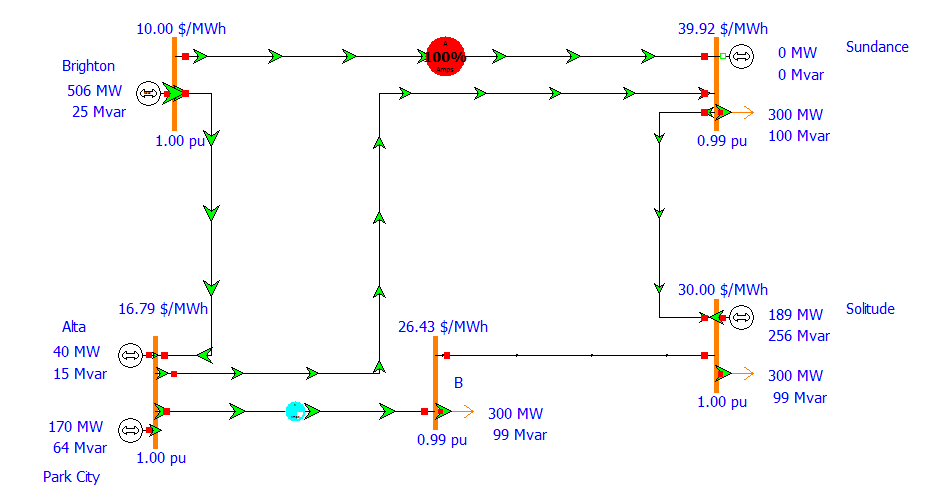
The PJM 5 bus test system [6], shown Figure 1, is to be utilized as an example for the application of cooperative game theory in sharing the SPS service cost among power system organizations.

Figure 1. PJM 5 bus test system.

References:
[1]     W. Fu, S. Zhao, J. D. McCalley, V. Vittal, N. Abi-Samra, “Risk Assessment for Special Protection Systems,” IEEE Transactions on Power Systems, vol. 17, no. 1, pp. 63-72. February 2002. Available: home.eng.iastate.edu/~JDM/WebJournalPapers/RiskAssessentSPS.pdf
[3]     J. K. Earle, “Functional unbundling of special protection systems as a required interconnected operating service in a deregulated environment,” MSEE Thesis, University of New Brunswick, 1997. Available: dspace.hil.unb.ca:8080/handle/1882/42522
[4]     H. Singh, “Introduction to Game Theory and Its Application in Electric Power Markets,” IEEE Computer Applications in Power, IEEE Computer Application in Power, vol.12, no.2, pp. 18-20, 22, Oct.1999.
[5]     J. Mepokee, D. Enke, B. Chowdhury, “Cost allocation for transmission investment using agent-based game theory,” International Conference on Probabilistic Methods Applied to Power Systems, Iowa State University, Ames, Iowa, September 12-16, 2004.
[6]     L. Fangxing, B. Rui, "Small Test Systems for Power System Economic Studies," Proceedings of the 2010 IEEE PES General Meeting, Minneapolis, MN, July 25-29, 2010.

Tuesday, September 25, 2012

Mindanao Approximate Grid Model

Here is your Mindanao Approximate Grid Model.


Mindanao Approximate Grid Model in PowerWorld


In coming up with the Mindanao model, I still followed the procedure I have developed in this post, with the following diversions:

  •  The transformers’ rating in this model are assumed, I can’t find any public information on the grid transformer ratings.
  •  The transmission lines’ ratings were assumed to be 100 MVA for the 69 kV lines, 215 MVA for the 138 kV lines (consistent with the Visayas modeling) and 300 MVA for the 230 kV lines.
  •  There is no publicly available for demand allocation for the Mindanao model. For this approximate model, the load distribution was based on the population of each region (group of provinces) from this Wikipedia page (http://en.wikipedia.org/wiki/Mindanao). I started with having 1200 MW of load and partitioned it per percentage population where the load substations are located.
  •  The network configuration was derived using the following data rich public sources:


Again, this is an approximate model and does not attempt to replicate what NGCP or WESM is using and the model is developed for educational and research purposes. There is no publicly available Mindanao grid model to benchmark this approximate model.

Again, a big gigantic thanks to PowerWorld for the very user-friendly and very visually attractive tool.

You can download the Mindanao approximate network model here, if you bump into a dead link, please drop me an email.


Sunday, September 23, 2012

Kundur Two-Area Test System


Kundur's two-area test system, from Prabha Kundur's book "Power System Stability and Control", is a power system utilized mostly for testing dynamics of solving stability issues.  Most researchers and engineers worked on this system to analyzed HVDC and FACTS impact on the transient stability. Other works were focused on small signal stability effect of such devices and/or Power System Stabilizers (PSS).

Single-line diagram of the Kundur two-area system.

The left part of the system is Area 1 and right part is Area 2. The ties (lines between buses 7, 8 and 9) are 110 km long thus the interconnection is rather not strong.

The system has dynamic data for the four machines and their exciters and stabilizers, aside from the power flow data. I took the power flow and dynamics data from "Implementation of an Adaptive Controller for Controlled Series Compensators in PSS/E". I adjusted the tie lines' data since the paper indicates that the lines were 150 km.

I will probably post power system dynamics tests using this system in the upcoming months (impact of PSS, critical clearing times, etc.).

You can download the test system built on PowerWorld v16 using this link.

Thursday, September 13, 2012

PJM 5 Bus System


Yet, another test system.

Well, power system operations, planning and markets are tested on these systems. Before electricity market designs are put into production phase, they are tested on some test systems. One of the most popular test systems for economic studies is the PJM 5 bus system.

Mostly, studies on locational marginal pricing (LMP) and security constrained unit commitment or economic dispatch have been studied on this small system.

Two notable sources which detail the system’s characteristic and usage are the following:


Replicated the results of the constrained and unconstrained scenarios from the PJM website below. The unconstrained results show equal LMP across the system, while the constrained system provides higher level of demand and the transmission line limits cause the LMP to be different.

Unconstrained case.

Constrained case.


You can download the PJM 5 bus system here. Use PowerWorld to simulate the results and don’t forget to input for generation cost output model which I assumed it to be piecewise linear cost function and go to Case Information Ã  OPF Ã  Areas, under AGC status set to OPF. Under Run mode, do the Primal LP OPF solution to acquire the results.

Friday, September 7, 2012

Visayas Grid Approximate Model


I have developed the Visayas Grid approximate model using available public data following the procedure given in my approximate Luzon network model. For the Visayas model, I used the line parameters given in the book “Probabilistic Transmission Planning” as shown below.


The single-line diagram was posted previously at wesm.ph but not currently. Still, publicly, Nick Nichol’s website has it – link.

Again, this is approximate and does not attempt to replicate what NGCP or WESM is using. Nevertheless, this model can be utilized by electrical engineering instructors in teaching power systems, analysis and issues in the electric power industry. It can be useful for computer based laboratory exercises in power systems, transmission and distribution. It is useful for research for technical reports or thesis during senior year. If there are Filipino electrical engineering instructors open to discussing how to use this model, I am very willing to cooperate and we can do this via skype or google+.

Some notes on developing the Visayas grid model:
  • The Visayas submarine cables are an important components together with the shunt reactors. Precise modeling of these components is not attempted.
  • The nature of Visayas grid is that it is not a meshed power system but is a radial power system: from Leyte-Samar to Bohol and Cebu to Negros to Panay Island. This means power flow solution algorithm being used can be tricky unlike in meshed power systems like that of Luzon.
  • Validating this model can be cumbersome, apply generation MW/cost bid parameters from wesm.ph and see if the locational marginal prices of this model and that of posted at wesm.ph matches up. If you would like to cooperate on this, I am open to doing it in PowerWorld. 

I’m not connected to PowerWorld, nor I’m endorsing it. It’s just that I am using it and because PowerWorld has practical power system applications like power flow, contingency analysis, shift factor calculations, optimal power flow, security constrained optimal power flow, short circuit analysis, and transient stability just to name a few. 

If you have questions or want the model, drop me an email at ebcano@gmail.com. Or download the model here.


Friday, May 11, 2012

Averting The Predicted 2013 Power Crisis

Google this "Rowaldo Del Mundo".

Instantly, you read lines and lines of the upcoming power crisis in the Philippines. At least my title says "predicted". Just like the forecasted electric demand, the power crisis supposedly happening in 2013 is forecasted, too. It is uncertain. Though the numbers tell us the generation capacity is short by that time compared to the demand, not only investments in generation capacity will surely help.

WESM has been employing demand response control in Visayas which prove to be effective in peak shaving. Large customers who own their generation in their facility help out in alleviating the need to put up power plants, which take some time to build, when they voluntarily interrupt their grid connection and depend on their in-house energy sources. In this case, WESM may design a demand response program which can provide peak shaving for normal and emergency grid operations. This may delay the shortage generation from short to medium term. This will also lessen transmission congestion since local generation will supply local loads.

Second, it's time for WESM to design a installed generation capacity market. The spot market in energy brings competition in the short term which is good but it's short term and just pay for the variable cost of power plants. The variable cost covers fuel and operating expenses of putting out MW to the grid. In a capacity market, the market operator will provide signal for investors and reward payment for that fixed costs in building power plants.

Third, DOE must reward large customers who practice energy efficiency programs. Energy efficiency may not be significant in impacting the level of electricity demand, however, better than no action. Measure their consumption during peak hours and see if they are contributing to alleviate the generation shortage.

I hope to come back on this interesting topic by 2013 and see what happened and what did not happen. By that time, I will still use Google.

Saturday, March 26, 2011

Philippines' Earth Hour 2011 - A Success!

I woke up reading tweets from VECO on the load being dropped regarding the Earth Hour 2011 on March 26, between 8:30 pm to 9:30 pm. VECO reports:

"EARTH HOUR RESULTS: The highest load drop In the VECO franchise area was 18 MW. Thank you to all those who participated!"

"EARTH HOUR RESULTS: As of 9:30 demand for VECO franchise area dropped to 248.89 MW."

"EARTH HOUR RESULTS: As of 9:15 p.m. demand dropped further to 249.76 MW in the VECO franchise area."

"In the VECO franchise area , As of 8:45 p.m. demand dropped to 257.1 MW. As of 9:00 p.m. it dropped further to 254.68 MW."

"AS of 8:45 p.m. VECO load dropped from 266.646 MW to 257.503 MW. Thank you for your support to Earth Hour!"

So from, VECO reports, about 9MW dropped after 15 minutes of the start of the energy conservation. Less than a MW dropped at 9:00 pm. At 9:15 pm, another chunk of about 7MW was dropped. Fifteen minutes after that, less than a MW was turned off. So at the end of the Earth Hour, VECO tweets that about 18MW was conserved.

Conserving that amount of energy,18MWh, is a big pull. It is a big accomplishment. What more if we look at the overall picture in the Philippines as a whole.

Figure 1

Figure 2
Figures 1-3 illustrates the load trend from the past Saturdays of March 2011. If we want to know the impact of the hour, we look at the load reduction in March 26 compared to March 19, March 12 and March 5. In this way, we are assuming that the load cycle exercised by the residential, industrial and commercial consumers are all alike. The insets in the figures shows that the hour of 8 pm to 10 pm in March 26 is at the lowest level compared with the other Saturdays except for the Luzon between the March 5th and the 26th at around 10:00 pm. 

Figure 3
A simple quantification of the load reduction is conducted by subtracting the average MW difference with the March 26th to other Saturdays in March 2011. The table below shows the numbers. All negative MW difference are good indicators. The positive number is as discussed above.

Table 1
Last year's Earth Hour seems to have failed. This year, the Earth Hour in the Philippines is a resounding success!