Search This Blog

Showing posts with label ELECTRICITY REGULATION. Show all posts

Tuesday, March 5, 2013

Electric Vehicle Charging Station Location using Fuzzy Optimization

Electric vehicle charging station location is a basic problem in integrating electric vehicles in electric power systems. An electric vehicle plugged into the electric distribution system may absorb or produce active and/or reactive power [1-4] depending on the need of the electric power system, Table 1 below.

Electric vehicle charger operating modes [4].


When finding the location of EV charging stations in order to support the electric distribution systems, the cost of EV charging, the impact on distribution system losses and voltage profile of the system are parameters needed to be considered. These variables are to be looked into when plugged in EV is either acting as a generator or a load given a system demand level.

Recent studies have solved this EV charging station location problem. In [5], a mixed integer programming solution was developed with site accessibility, local jobs and population densities and trip attributes as main constraints. A genetic programming approach is utilized in [6] for simulation of electric vehicles on a real map of a European city where the optimal solution of the charging infrastructure is derived based on mean trip times of electric vehicles. A two step procedure is proposed in [7] where the authors included environmental factors and service radius of EV charging stations in the screening first step and built a modified primal-dual interior point algorithm (MPDIPA) for optimal sizing of EV charging stations with the minimization of total cost associated with EV charging stations to be planned as the objective function with losses and voltage profile included in the problem. Reference [8] introduces an optimization process for sizing and siting of EV charging stations, modeling the charging demand and the structure of road network to where the solution approach was graph theory. Level 1 and level 2 charging stations are discussed in [9] and how to allocate them for residential EV users using simulation-optimization strategy.

Recent studies do not consider uncertainties and imprecision which can be captured using fuzzy optimization. Fuzzy set theory can provide a simpler yet powerful solution for allocating EV charging stations in electric distribution systems. The Civanlar test system [11] will be utilized for the study and assuming that capital investment of the EV charging station is the same for all distribution system candidate nodes while considering time of use (TOU) electricity tariff, distribution system losses and voltage profiles.

References

[1] Chenye Wu, Hamed Mohsenian-Rad, and Jianwei Huang, “PEV-based Reactive Power Compensation for Wind DG Units: A Stackelberg Game Approach”, in Proc. of the IEEE Conference on Smart Grid Communications (SmartGridComm’12), Tainan City, Taiwan, October 2012.
[2]   Chenye Wu, Hamed Mohsenian-Rad, Jianwei Huang, Juri Jatskevich, “PEV-Based Combined Frequency and Voltage Regulation for Smart Grid”, the 3rd IEEE Innovative Smart Grid Technologies Conference, Washington DC, Jan 2012.
[3]    M. Kisacikoglu, B. Ozpineci, L. M. Tolbert, "V2G Reactive Power Compensation Using a PHEV Bidirectional Charger Interface Rated at Level 1, 2, and 3 Charging Standards," IEEE Energy Conversion Congress and Exposition, Atlanta, Georgia, Sept. 12-16, 2010.
[4]     M. Kisacikoglu, B. Ozpineci, L. M. Tolbert, "Examination of a PHEV Bidirectional Charger System for V2G Reactive Power Compensation," IEEE Applied Power Electronics Conference, Palm Springs, California, Feb. 21-25, 2010, pp. 458-465.
[5]    Chen, T. D., et al, “The Electric Vehicle Charging Station Location Problem: A Parking-Based Assignment Method for Seattle”, on-line: http://www.caee.utexas.edu/prof/kockelman/public_html/TRB13EVparking.pdf
[6]    Hess, A. Et al, “Optimal Deployment of Charging Stations for Electric Vehicular Networks”, on-line:http://conferences.sigcomm.org/co-next/2012/eproceedings/urbane/p1.pdf
[7]    Liu, Zhipeng, Wen, F. and  Ledwich, G. F. , “Optimal Planning of Electric-Vehicle Charging Stations in Distribution Systems”, IEEE Transactions on Power Delivery, Jan. 2013, Vol. 28 , Issue 1.
[8]    Jia, L., Hu, Z., Song, Y., Luo, Z., “Optimal siting and sizing of electric vehicle charging stations”, 2012 IEEE International Electric Vehicle Conference (IEVC), 4-8 March 2012
[9]    Xi, X., et al, “Simulation-Optimization Model for Location of a Public Electric Vehicle Charging Infrastructure”, on-line:http://www.ise.osu.edu/ISEFaculty/sioshansi/papers/charge_infra.pdf

Thursday, December 13, 2012

E-Trikes and WESM


Using the 12-12-12 data from WESM, I plotted here the Luzon demand and Luzon LWAP with the inclusion of E-Trike. The peak load for this day was 7,191.7 MW (2 pm) and the lowest LWAP was P1,690.43 per MWh (4 am). For this day, the highest LWAP (P13,145.7/MWh at 6 pm) does not coincide with the peak load.

E-Trikes and WESM.

In the chosen scenario, the 100,000 E-Trikes will be aggregated and charged as one bulk load, but on the other hand, will take advantage of the LWAP at its lowest and be coordinated when the system demand is also at its lowest (off-peak) both from 3 am to 5 am.

Though the 100,000 E-Trikes are envisioned to hit the streets by 2017, it is necessary to study a "what-if" condition on whether the present generation capacity, at least in Luzon, will be able to accommodate the new 493 MW load of E-Trikes. From the NGCP website, the system capacity is 8,091 MW with peak load of 7,318 MW so that's why we have a generation reserve of 773 MW. If the charging of E-Trike is not done during the low load and low LWAP hours, the 493 MW of E-Trike will be added to the current peak load which will bring down the generation reserve to about 280 MW. If the largest contingency is more than 280 MW, the system will be operated at “Alert State”. This shows how important the timing of the E-Trikes’ charging when aggregated as one bulk load. Though when added as a load in the system, the E-Trikes as a load may impact the system price not as depicted in the graph.

The strategy of handling E-Trikes as an additional aggregated load in the power grid would be:

  • Charge when the LWAP is at its lowest – from economic standpoint, it makes sense. The E-Trike aggregator will enjoy economic benefits rather than utilizing uncoordinated charging related with LWAP which is to charge at random during a given day.
  • Charge when the demand is lowest – from generation capacity and system reliability viewpoints, this will provide support to the power system. Coordination of the E-Trike load with the demand curve may delay the need for additional generation capacity or investments.

In reality, some E-Trikes will be on the streets throughout the day/night. There are transportation needs to be met at night and any time during the day especially in urban locations so it is unlikely there will be 100,000 E-Trikes charging at the same time.

What is discussed here is a worst-case-what-if scenario which may allow us to think if the present generation capacity may be able to accommodate such 493 MW of E-Trike load. So as long as the bulk load does not plug into the grid during peak hours, economic and technical benefits are achievable.

Thursday, December 6, 2012

Benefits from Electric Vehicles for the Philippine Power Grid


The last blogs I posted on electric vehicles (EV) may seem to have created the wrong impression in what I’m trying to do. I analyzed the loading impacts of E-Jeepneys and E-Trike to local electric distribution power system, specifically loading up a pole mounted distribution transformer. In practice, these scenarios are very real and can be prevented by planning and coordinating new loads which are the EVs under the government’s program.

The overloading of electrical equipment, at least locally, is just one tiny bit on one side of the fence. EVs when largely manufactured and utilized can be a resource of power grid reliability and security support, just like any other ancillary services.

References [1-4] provide simulations and analysis on the following:
  • Frequency regulation – NGCP procures frequency regulation from on-line generators which are called spinning reserves. A big bulk of load can be aggregated and adjust accordingly to maintain system frequency, like a spinning generating reserve. I posted that the vision of DOE to have 100,000 E-Trikes by 2017 will have a MW load greater than the Quezon Power plant which is 480 MW. EV charging is via power electronic converters/inverters which are controllable. The charging of E-Trikes if coordinated accordingly to serve a load serving as a spinning reserve is a promising capability for E-Trikes or any large scale electric vehicle when aggregated.
  • Reactive power compensation – Again, NGCP installs and may procure voltage support services from generation or invest on its own reactive power devices. In [3], the authors described an EV charging system which can be a source of reactive power compensation. This system is allowed to inject or consume reactive power whichever is needed by the power system in real time. In [4], the authors provided a pricing methodology for wind farm reactive compensation provided by an EV charging park.
  • Contribution to system security – NGCP procures contingency reserves per Philippine Grid Code.  These are generators which are on-line ready to respond (increase or decrease their output) in times of a system disturbance. Authors in reference [2] indicate that EV chargers have response time faster than generators. In this case, going back to the 100,000 E-Trike, you may have a large “generator” providing that contingency reserve to mitigate any undesirable system condition due to a disturbance.
For large scale E-Trike or E-Jeepney charging, which is envisioned in the Philippines, these features would become income generating resources for EV operators or aggregators. Also, the NGCP will have another source of ancillary services which can be counted upon to support grid reliability and security.

References:
[1]    Chenye Wu, Hamed Mohsenian-Rad, Jianwei Huang, Juri Jatskevich, “PEV-Based Combined Frequency and Voltage Regulation for Smart Grid”, in Proc. of the IEEE PES Innovative Smart Grid Technologies Conference (ISGT’2012), Washington, DC, January 2012.
[2]    Sakis Meliopoulos, Jerome Meisel, George Cokkinides and Thomas Overbye, "Power System Level Impacts of Plug-In Hybrid Vehicles." PSERC Document 09-12, PSERC Final Report. October 2009.
[3]    M. Kisacikoglu, B. Ozpineci, L. M. Tolbert, "Examination of a PHEV Bidirectional Charger System for V2G Reactive Power Compensation," IEEE Applied Power Electronics Conference, Palm Springs, California, Feb. 21-25, 2010, pp. 458-465.
[4]    Chenye Wu, Hamed Mohsenian-Rad, and Jianwei Huang, “PEV-based Reactive Power Compensation for Wind DG Units: A Stackelberg Game Approach”, accepted for publication in Proc. of the IEEE Conference on Smart Grid Communications (SmartGridComm’12), Tainan City, Taiwan, October 2012.

Wednesday, December 5, 2012

E-Trike: Impact on Distribution Transformer Loading


The partnership of DOE and ADB envisions having 100,000 E-Trikes between now and 2017 [1]. Each E-Trike will have about 3 kW to 5 kW electric power usage and will be charging for about 45 minutes to 1 hour.

A study by DOE in collaboration with United Nations [2] indicated that one E-Trike will consume 1.8 MWh in one year. So to check the values here: 1.8 MWh divided by 365 days, an E-Trike will take 4.93 kWh. Below is a table for the kW loading of E-Trike(s). Note that 100,000 E-Trikes is even above the capacity of Quezon Power plant which has 480 MW capacity.


In this post, several scenarios of charging time and number of E-Trikes are presented using 4.93 kW charging power.

Figure 1 presents the connection of 1 E-Trike during three separate hours in the evening versus a 25 kVA distribution transformer. In here, the assumption is the E-Trike driver uses the vehicle from 8am to 5pm, then comes home to his family and charges his vehicle on those random hours. If 1 E-Trike is being connected with the base residential load curve, the 25 kVA distribution transformer will have no overloading.

Figure 1
Figure 2

Figure 2 shows the plots of several number of E-Trike being charged on separate hours of the day. For this case, the assumption is the E-Trike operator/businessman who has several vehicles takes advantage his vehicle charging according to the Time of Use (TOU) rates of the distribution utility. He may utilize a timer-switch to program when the charging begins and ends.  A 25 kVA distribution transformer will overload for the assumed hours for both during evening and during morning except for 3 E-Trikes during morning. A distribution utility coordination with this E-Trike operator will identify that an upgrade from 25 kVA to 37.5 kVA transformer will provide mitigation of the overload unless other households in the service area will shut down all their appliances ( voluntary load shedding).

References:

[1] Consultants sought for $500-M e-Trike project. Available: 
http://business.inquirer.net/74917/consultants-sought-for-500-m-e-trike-project
[2] Philippine Electric Vehicle Project. Available: http://cdm.unfccc.int/filestorage/3/K/Y/3KY4J2IW70AZPTX9MS6VGU1QORNE8F/Etrike%20CPA-DD%20ver1.pdf?t=MGF8bWVremlifDCLzXH3EtuSp9elyiR5MR_6

Tuesday, December 4, 2012

Loading Impacts of PHUV Electric Jeepney

It is interesting that while the US is looking into the impact of PHEVs on the existing electric grid infrastructure, the Philippines is producing it's own electric vehicles.

http://electric-vehicles-philippines.blogspot.com is a website detailing most of these products. From E-Jeepneys, electric motorcycles and electric tricycles or electric taxicles, they have it all.

Figure 1. PHUV Electric Jeepney (from http://electric-vehicles-philippines.blogspot.com/2010/04/phuv-electric-jeepney.html)

Though IEEE literature have investigated the impact of PHEVS on distribution transformer loading [1-3], Philippine electric vehicles are very different from the studied PHEVs. No literature have studied the local and global effects of these electric vehicles on the Philippine electric power systems.

In this post, loading impact of charging a PHUV Electric Jeepney on a given distribution transformer. Normally, a distribution transformer serves about five to seven households. A typical load curve is provided in Figure 1, taken from reference 4. The load curve is given in MW and was scaled down to kW. The figure also includes capacities of a 25 kVA and a 37.5 kVA distribution transformers. In the figure, neither of the transformer is overloaded.

Figure 2. Typical residential load curve.

From [5], the PHUV Electric Jeepney charging process is provided:
"PHUV batteries amp hour capacity rating is 220 amp hrs. Since they have a 72 volt system, they have 12 pcs of 6 volt deep cycle batteries. That's 16000 watt hours or 16 kilowatt hours at P8 per kwhour (Meralco rate with all the side charges) is equal to P128 or $2.8 per 8 hour full charge. So if it runs for 65 kms then that's 1.97 per km or 5 US cents per km."
To check the calculation, P = V x I ( P = 72 x 220 = 15,840 watts) . Converting it to kW, P = 15.84 kW which is fully charged for 8 hours. Note that 15.84 kW is above half of a 25 kVA transformer capacity and about 42% loading a 37.5 kVA transformer.

Assuming that the PHUV is utilized for public transport from 8am to 5pm, to integrate the PHUV into the load curve above, three scenarios are studied: (1) charge the PHUV from 6 pm to 2 am, (2) charge the PHUV from 1 am to 8 am, and (3) charge the PHUV from 11 pm to 7 am.

Figure 3 shows the load curve with an additional one (1) PHUV charging considering the three charging scenarios cited above. From the figure, a 25 kVA transformer will overload for charging scenario (1) and will be heavily loaded for the other scenarios.

Figure 3. Residential load curve with 1 PHUV charging.
Figure 4 shows the load curve with an additional two (2) PHUV charging considering the three charging scenarios cited above. From the figure, a 25 kVA transformer will be heavily overloaded for all charging scenarios and even the 37.5 kVA distribution transformer will overload for all charging scenarios.

Figure 4. Residential load curve with 2 PHUV charging.
Electric vehicles are good for the environment and will provide a boost in the Philippine economy since they are locally made. However, it is imperative to look into the loading impact of electric vehicles since they will provide distribution transformer overloading if not investigated.

Further analysis will include additional charging scenarios of electric motorcycles and electric tricycles in the mix. Also, a global outlook analysis is needed if the Philippine power grid as a whole can handle the forecasted usage of electric vehicles in the country.

References:
  1. Shao, Shengnan; Zhang, Tianshu; Pipattanasomporn, Manisa; Rahman, Saifur; , "Impact of TOU rates on distribution load shapes in a smart grid with PHEV penetration," Transmission and Distribution Conference and Exposition, 2010 IEEE PES, 19-22 April 2010
  2.  S. Shao, M. Pipattanasomporn and S. Rahman, "Demand Response as a Load Shaping Tool in an Intelligent Grid with Electric Vehicles”, IEEE Transactions on Smart Grid, vol. 2, No. 4, December 2011, pp. 624-631. 
  3.  S. Shao, M. Pipattanasomporn, and S. Rahman,"Challenges of PHEV Penetration to the Residential Distribution Network,"  IEEE/PES 2009 General Meeting, Power & Energy Society General Meeting, 2009. PES '09. IEEE, Calgary, AB, Canada,  July, 27th, 2009.
  4. Occidental Mindoro Electric Cooperative, Inc. Information Memorandum. Available: http://www.omeco.com.ph/files/pdf/OMECO%20INFORMATION%20MEMORANDUM.pdf
  5. PHUV Electric Jeepney - http://electric-vehicles-philippines.blogspot.com/2010/04/phuv-electric-jeepney.html

Tuesday, November 20, 2012

Reduced and Approximate Models of Philippine Major Island Power Grids


Abstract—The restructuring of electric power industry brings challenges and opportunities among its stakeholders. Economic and engineering analyses brought forth by these changes are usually tested on power system test models to study different strategies. In a developing country, like the Philippines, where commercial and security concerns may prevent the availability of these test systems, the involvement of research and academic communities’ maybe limited. This paper reports the development of reduced and approximate power system models for major islands in the Philippines using publicly available data which can be utilized for research and academic purposes.

Index Terms—Electric power test systems, interconnected power systems, electric power system modeling.

Download the full paper here.

Thursday, October 18, 2012

Cost Allocation of SPS Service Using Cooperative Game Theory


Power systems planning and operations are usually defined by N-1 criterion. This means that in an event of a single contingency, no remaining connected transmission elements will be thermally overloaded, no bus voltage will be outside of acceptable limits, no system interface limit is violated, and system stability is maintained.

Special Protection Systems or SPS are widely utilized for increasing power transfer in transmission systems at the same time respecting security constraints [1]. SPS applications usually are generation rejection schemes (GRS), line/transformer transfer tripping and load shedding. GRS are designed to mitigate overloading of a transmission line or lines after an N-1 contingency near the vicinity of a generating plant or are employed to arrest increasing dynamic oscillation which may lead to unstable system conditions. Without the GRS, generation output is curtailed to satisfy the N-1 security criterion. With the GRS, the output of the generation is increased thereby increasing power transfer. Further, GRS also mitigates or delays the possibility of transmission expansion or investment due to transmission capacity constraints.

In a locational marginal pricing based electricity market, curtailment of generation (without GRS), specifically of a cheap generation due to the security N-1 criterion can be considered as transmission congestion. Transmission capacity limitations impede the generation output thereby decreasing the profit opportunity of the generation company (GenCo).  If a GRS is installed for this GenCo, the output of the GenCo is increased and thus there is a clear benefit for the GenCo in terms of profit. When transfer capability is limited, without GRS, the profit of a transmission owner (TO) is decreased due to less power wheeling charges. With the GRS, wheeling charges increase as a consequence of the added power transfer. This premise is the same with the electricity system and market administrator, called independent system operator (ISO), since the ISO charges for cost-based services including scheduling, system control and dispatch.  For the demand side, when generation output is curtailed due to congestion, without GRS, the resulting nodal prices at the demand’s location maybe higher than when a GRS is in place to increase generation output from a cheap generation.

GRS installations have embedded cost and actual service cost [3]. Since electricity market participants have various benefits in having a GRS installation, the cost of the SPS/GRS service must be allocated among the participants. Cooperative game theory [4-5] can be utilized in allocating fair cost on the beneficiaries of the SPS service.

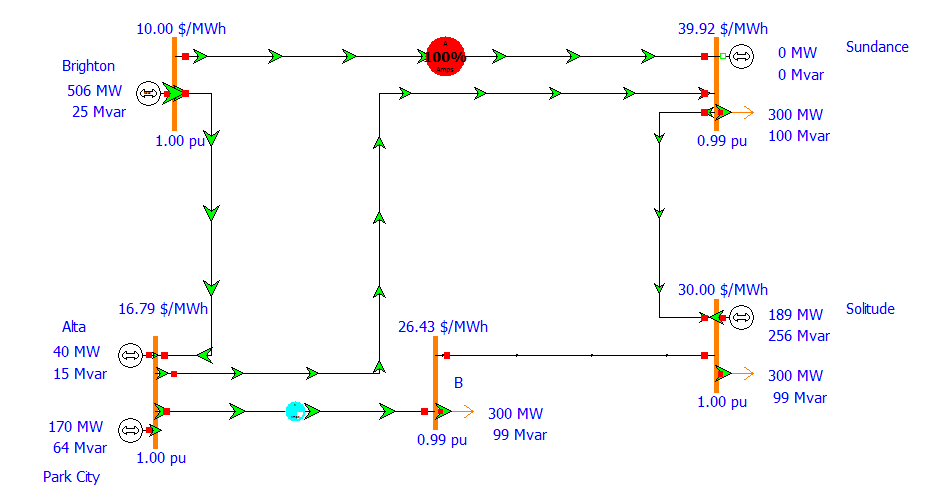
The PJM 5 bus test system [6], shown Figure 1, is to be utilized as an example for the application of cooperative game theory in sharing the SPS service cost among power system organizations.

Figure 1. PJM 5 bus test system.

References:
[1]     W. Fu, S. Zhao, J. D. McCalley, V. Vittal, N. Abi-Samra, “Risk Assessment for Special Protection Systems,” IEEE Transactions on Power Systems, vol. 17, no. 1, pp. 63-72. February 2002. Available: home.eng.iastate.edu/~JDM/WebJournalPapers/RiskAssessentSPS.pdf
[3]     J. K. Earle, “Functional unbundling of special protection systems as a required interconnected operating service in a deregulated environment,” MSEE Thesis, University of New Brunswick, 1997. Available: dspace.hil.unb.ca:8080/handle/1882/42522
[4]     H. Singh, “Introduction to Game Theory and Its Application in Electric Power Markets,” IEEE Computer Applications in Power, IEEE Computer Application in Power, vol.12, no.2, pp. 18-20, 22, Oct.1999.
[5]     J. Mepokee, D. Enke, B. Chowdhury, “Cost allocation for transmission investment using agent-based game theory,” International Conference on Probabilistic Methods Applied to Power Systems, Iowa State University, Ames, Iowa, September 12-16, 2004.
[6]     L. Fangxing, B. Rui, "Small Test Systems for Power System Economic Studies," Proceedings of the 2010 IEEE PES General Meeting, Minneapolis, MN, July 25-29, 2010.

Tuesday, September 25, 2012

Mindanao Approximate Grid Model

Here is your Mindanao Approximate Grid Model.


Mindanao Approximate Grid Model in PowerWorld


In coming up with the Mindanao model, I still followed the procedure I have developed in this post, with the following diversions:

  •  The transformers’ rating in this model are assumed, I can’t find any public information on the grid transformer ratings.
  •  The transmission lines’ ratings were assumed to be 100 MVA for the 69 kV lines, 215 MVA for the 138 kV lines (consistent with the Visayas modeling) and 300 MVA for the 230 kV lines.
  •  There is no publicly available for demand allocation for the Mindanao model. For this approximate model, the load distribution was based on the population of each region (group of provinces) from this Wikipedia page (http://en.wikipedia.org/wiki/Mindanao). I started with having 1200 MW of load and partitioned it per percentage population where the load substations are located.
  •  The network configuration was derived using the following data rich public sources:


Again, this is an approximate model and does not attempt to replicate what NGCP or WESM is using and the model is developed for educational and research purposes. There is no publicly available Mindanao grid model to benchmark this approximate model.

Again, a big gigantic thanks to PowerWorld for the very user-friendly and very visually attractive tool.

You can download the Mindanao approximate network model here, if you bump into a dead link, please drop me an email.


Thursday, September 13, 2012

PJM 5 Bus System


Yet, another test system.

Well, power system operations, planning and markets are tested on these systems. Before electricity market designs are put into production phase, they are tested on some test systems. One of the most popular test systems for economic studies is the PJM 5 bus system.

Mostly, studies on locational marginal pricing (LMP) and security constrained unit commitment or economic dispatch have been studied on this small system.

Two notable sources which detail the system’s characteristic and usage are the following:


Replicated the results of the constrained and unconstrained scenarios from the PJM website below. The unconstrained results show equal LMP across the system, while the constrained system provides higher level of demand and the transmission line limits cause the LMP to be different.

Unconstrained case.

Constrained case.


You can download the PJM 5 bus system here. Use PowerWorld to simulate the results and don’t forget to input for generation cost output model which I assumed it to be piecewise linear cost function and go to Case Information Ã  OPF Ã  Areas, under AGC status set to OPF. Under Run mode, do the Primal LP OPF solution to acquire the results.

Friday, September 7, 2012

Visayas Grid Approximate Model


I have developed the Visayas Grid approximate model using available public data following the procedure given in my approximate Luzon network model. For the Visayas model, I used the line parameters given in the book “Probabilistic Transmission Planning” as shown below.


The single-line diagram was posted previously at wesm.ph but not currently. Still, publicly, Nick Nichol’s website has it – link.

Again, this is approximate and does not attempt to replicate what NGCP or WESM is using. Nevertheless, this model can be utilized by electrical engineering instructors in teaching power systems, analysis and issues in the electric power industry. It can be useful for computer based laboratory exercises in power systems, transmission and distribution. It is useful for research for technical reports or thesis during senior year. If there are Filipino electrical engineering instructors open to discussing how to use this model, I am very willing to cooperate and we can do this via skype or google+.

Some notes on developing the Visayas grid model:
  • The Visayas submarine cables are an important components together with the shunt reactors. Precise modeling of these components is not attempted.
  • The nature of Visayas grid is that it is not a meshed power system but is a radial power system: from Leyte-Samar to Bohol and Cebu to Negros to Panay Island. This means power flow solution algorithm being used can be tricky unlike in meshed power systems like that of Luzon.
  • Validating this model can be cumbersome, apply generation MW/cost bid parameters from wesm.ph and see if the locational marginal prices of this model and that of posted at wesm.ph matches up. If you would like to cooperate on this, I am open to doing it in PowerWorld. 

I’m not connected to PowerWorld, nor I’m endorsing it. It’s just that I am using it and because PowerWorld has practical power system applications like power flow, contingency analysis, shift factor calculations, optimal power flow, security constrained optimal power flow, short circuit analysis, and transient stability just to name a few. 

If you have questions or want the model, drop me an email at ebcano@gmail.com. Or download the model here.


Friday, May 11, 2012

Averting The Predicted 2013 Power Crisis

Google this "Rowaldo Del Mundo".

Instantly, you read lines and lines of the upcoming power crisis in the Philippines. At least my title says "predicted". Just like the forecasted electric demand, the power crisis supposedly happening in 2013 is forecasted, too. It is uncertain. Though the numbers tell us the generation capacity is short by that time compared to the demand, not only investments in generation capacity will surely help.

WESM has been employing demand response control in Visayas which prove to be effective in peak shaving. Large customers who own their generation in their facility help out in alleviating the need to put up power plants, which take some time to build, when they voluntarily interrupt their grid connection and depend on their in-house energy sources. In this case, WESM may design a demand response program which can provide peak shaving for normal and emergency grid operations. This may delay the shortage generation from short to medium term. This will also lessen transmission congestion since local generation will supply local loads.

Second, it's time for WESM to design a installed generation capacity market. The spot market in energy brings competition in the short term which is good but it's short term and just pay for the variable cost of power plants. The variable cost covers fuel and operating expenses of putting out MW to the grid. In a capacity market, the market operator will provide signal for investors and reward payment for that fixed costs in building power plants.

Third, DOE must reward large customers who practice energy efficiency programs. Energy efficiency may not be significant in impacting the level of electricity demand, however, better than no action. Measure their consumption during peak hours and see if they are contributing to alleviate the generation shortage.

I hope to come back on this interesting topic by 2013 and see what happened and what did not happen. By that time, I will still use Google.

Saturday, March 26, 2011

Philippines' Earth Hour 2011 - A Success!

I woke up reading tweets from VECO on the load being dropped regarding the Earth Hour 2011 on March 26, between 8:30 pm to 9:30 pm. VECO reports:

"EARTH HOUR RESULTS: The highest load drop In the VECO franchise area was 18 MW. Thank you to all those who participated!"

"EARTH HOUR RESULTS: As of 9:30 demand for VECO franchise area dropped to 248.89 MW."

"EARTH HOUR RESULTS: As of 9:15 p.m. demand dropped further to 249.76 MW in the VECO franchise area."

"In the VECO franchise area , As of 8:45 p.m. demand dropped to 257.1 MW. As of 9:00 p.m. it dropped further to 254.68 MW."

"AS of 8:45 p.m. VECO load dropped from 266.646 MW to 257.503 MW. Thank you for your support to Earth Hour!"

So from, VECO reports, about 9MW dropped after 15 minutes of the start of the energy conservation. Less than a MW dropped at 9:00 pm. At 9:15 pm, another chunk of about 7MW was dropped. Fifteen minutes after that, less than a MW was turned off. So at the end of the Earth Hour, VECO tweets that about 18MW was conserved.

Conserving that amount of energy,18MWh, is a big pull. It is a big accomplishment. What more if we look at the overall picture in the Philippines as a whole.

Figure 1

Figure 2
Figures 1-3 illustrates the load trend from the past Saturdays of March 2011. If we want to know the impact of the hour, we look at the load reduction in March 26 compared to March 19, March 12 and March 5. In this way, we are assuming that the load cycle exercised by the residential, industrial and commercial consumers are all alike. The insets in the figures shows that the hour of 8 pm to 10 pm in March 26 is at the lowest level compared with the other Saturdays except for the Luzon between the March 5th and the 26th at around 10:00 pm. 

Figure 3
A simple quantification of the load reduction is conducted by subtracting the average MW difference with the March 26th to other Saturdays in March 2011. The table below shows the numbers. All negative MW difference are good indicators. The positive number is as discussed above.

Table 1
Last year's Earth Hour seems to have failed. This year, the Earth Hour in the Philippines is a resounding success!


Thursday, March 24, 2011

PHL Power Plants in Google Map

'There is no known exhaustive locational map of Philippine power plants on-line. So, from this need, I took my free time to work.

From Nick Nichols post on "Philippine Power Plants – Carbon Emissions", I got the link to Carbon Monitoring for Action (CARMA). CARMA has a massive database for power plants' carbon emission which also contains locations of the plants using latitude and longitude. Their database on the generating plants in the Philippines are around 512 power plants. The list includes generation connected to the transmission grid, embedded generation and some generation used by industrial and commercial facilities. Though they have that number of plants, only about 250 plants have specific location.

I utilized an online tool to generate the KML file for Google Map which is free from Earth Point. The tool requires a spreadsheet format of the dataset which was prepared in OpenOffice Calc, a free software. The KML file generated is also compatible with Google Earth.

Here are the figures of the mapping of the power plants.

PHL Luzon Power Plants

View PHL Luzon Power Plants in a larger map

PHL Visayas-Mindanao Power Plants

View PHL Vis-Min Power Plants in a larger map

There are ways to improve this work. Classify the power plants using color code by fuel type, grid or distribution or industrial connected, or by classifying them by capacity level or by classifying the plants' cost of power.

The keyword here is FREE. Free time. Free data. Free tools. Good project!

Update: I categorized the power plants by region -- Luzon and Vis-Min. The map displays are having error on this blog because of the limitation of number of rows read by Earth Point. 03-25-2011

Tuesday, March 22, 2011

Wind Power Capacity Value in the Philippines

Prof. Rowaldo Del Mundo, my respected professor in UP-Diliman, came out with the study of quantifying the value of wind power in terms of capacity last year. I believe this is welcome advancement in understanding the contribution of wind energy in the country. As investments in renewable energy sources are coming in, studies like this are sure to support the anticipated technical and economic impacts of integrating wind power into the grid.

However, just as I was taught by the good professor, there are some loopholes in the study I thought needing some discussion thereof.

First, the study considered wind power plants to have an equivalent forced outage rate (EFOR). Forced outage rate (FOR)  is computed using the mean time to failure and the mean time to repair of a component of a generating plant to be in service or not. The Philippine Grid Code defines FOR as:


From this premise, FOR is a component based value not a fuel availability based variable. Wind power is variable. A wind farm stops to produce power when wind stops blowing, not mainly because a component in the wind farm fails.

An accepted approach to overcome the FOR modeling of a wind farm is to model the wind power output as a negative load. Studies here and here by IEEE and NERC uses this practical strategy since load is variable and adding wind power increases the variability is the power system. With this, you don't have to assume an EFOR for electrical or mechanical components inside the wind farm since they don't really fail, its just that the wind is not blowing.

Second, the study's conclusion includes this: The maximum penetration limit is, at the end not a technical issue, it is an economic issue that must  be resolved based on willingness to pay of the consumers.

I remember that when the 1216MW Sual power plant suffered failure and resulted to a Luzon wide blackout. Imagine the peak load of Luzon as about 6500MW, the capacity output of Sual is 25% of that loading condition. Which gives us a scenario that a plant generating 25% of the demand level provides risk in the system operational reliability. If wind power penetration becomes 25% of any demand level, we are merely replicating the possibility of what happened in 2001 since wind is variable. The integration of any energy resource in any grid would always be a technical issue. That is why Prof. Del Mundo was part of the team who they developed the Grid Code and the Distribution Code.

A single study must not generalize such conclusion without looking at all angles and involving all stakeholders.

Third, the study cites that the capacity value of wind in the Luzon grid is nil. Zero. Nada. This is surprising. Any resource adds capacity. Any amount of energy resource penetration level adds value. Below is a figure from this IEEE study.


The figure above tells us that there is a certain capacity value relative to a certain amount of wind power penetration in various electric transmission systems. I am wondering what is very unique in the Philippine electric power systems to have wind power assessed as having no capacity value when added to the grid.  

Wind power will play an important role in the energy situation in our country though it is variable in nature. It will add resource and capacity together with conventional plants, much needed as demand grows. We must study its impact carefully.

Friday, February 11, 2011

Administrative Losses

The figure below presents the administrative loss percent of each electric cooperative considering the number of employees for each cooperative.


In this post, I consider the administrative loss to be proportional to the number of employees.

In this terms, the more employees, the more electricity usage within their facilities. So less usage means less employees working for the cooperative. The efficient electric cooperative would have less administrative loss given more employees.

With this premise, Tarlac I looks like an efficient operated cooperative since it has more employees yet they incur less power losses for their facilities. On the other hand, Davao Sur has less employees but has spent more administrative losses.

Thursday, February 10, 2011

Philippine Electric Cooperatives' System Loss

The following figure presents the system loss in percent of all electric cooperatives in the Philippines. Data came from the NEA website.

The average system loss throughout the five year period is about 15%. The median system loss is around 14%. This is not bad for the NEA, though some cooperative suffer with significant power losses in their distribution system as seen from the figure above.  It is notable that high system loss are found in Mindanao, Central Luzon, Bicol and parts of Visayas.

Tuesday, February 1, 2011

Framework for Reliability Evaluation of the Smart Grid

Massive deployment of information and communication infrastructure in operating, monitoring and control of electric power systems. This is Smart Grid. This is the vision of a controllable, observable and self-healing power system using smart grid technologies. Communication technologies like fiber hybrid and broadband over power line will enable the data and signal transfer from smart meters, automation and control sensing devices, high end system control centers interfaces in a highly visual environment, and intelligent electronic devices (IEDs). Sensing and measurement devices will be employed for which information data flow are aimed for facilitating wide-area control and protection (WACP) at the bulk power systems and dynamic control and automation at the distribution level, and other applications such as remedial action schemes, substation equipment monitoring and dynamic line rating.

Please see full article here - Framework for Reliability Evaluation of the Smart Grid 

Friday, August 27, 2010

Energy Efficiency Impact on Demand

Recent news on the DOE secretary was about his speech at an energy forum attended by electric power industry stakeholders. The secretary was quoted to point at energy efficiency as a solution to the crisis in energy. He said if people would practice the Energy Efficiency Protocol,  the expected demand reduction will be 20% for residential load and 25% for industrial/commercial demand. If residential load is say 30% of the total grid demand then we can follow a formula like,

            TD_Eff = Res(0.8) + Ind(0.75) = (0.3)TD(0.8) + (0.7)TD(0.75) 

TD is the total demand and TD_Eff is the TD with energy efficiency at the demand side.

The DOE secretary also mentioned the energy savings from using energy efficient devices will solve the power shortage for three to four years. Following the DOE forecast on Visayas and applying the formula above, I wanted to verify the declaration.


Looking at the graph above, the DOE demand forecast is above the dependable generation capacity. When energy efficiency is accounted, the demand goes below the dependable capacity for the upcoming four years.

Does this solve the power shortage? No.

Grid operations require generation reserves to maintain system frequency and prepare for unforeseen grid contingencies. In real time, there are generation or transmission outages due to planned maintenance or forced outages.Visayas grid, as per NGCP website requires about 190MW for its generation reserves at the present time. Apparently, load will catch up with the generation capacity in 2013 based on DOE's projections.

Energy efficiency is good not only for the reduction of grid demand but also it makes the grid environment friendly. It will surely help, but given the situation, it does not solve the power shortage for the coming four years.

PS - At present, the dependable capacity in the Visayas alone is at 1,505 MW while peak demand is at 1,430 MW, with a required reserve margin of 335 MW.

Wednesday, August 18, 2010

Elektrisidad Pilipinas Cited at Philippine Online Chronicles

The work done on the approximate model of the Luzon power network and the rationale for its need was cited by the Philippine Online Chronicles. Below is an excerpt of the commentary where this blog was noted. 


Monday, August 16, 2010

Using the Approximate Luzon Network Model for Power Engineering Education and Training

Educators and trainers can utilize the model in lectures or laboratories for discussion of the following:

1.    Power flow analysis
2.    Application of grid code limits on branch thermal capacity and bus voltages with or without outages
3.    Application of N-1 contingency
4.    Determination of maximum generation of an area with or without N-1 contingency
5.    Determination of  the limiting contingency for dispatching maximum generation of a plant
6.    Determination of the maximum generation that can be interconnected to a specific bus without violating grid code limits on branch thermal capacity and bus voltages with or without N-1 contingency
7.    Determination of   how much load growth can be accommodated without transmission/generation expansion
8.    Determination of   the generation margin/reserves at peak and off peak conditions
9.    Impact of enabling on load transformer taps on bus voltages
10.    Impact of limited reactive power capacity of a certain plant on bus voltages
11.    Impact of outage(s) of 500kV line(s) on the system
12.    Impact of outage(s) of 500kV transformer(s) on the system
13.    Impact of load power factor of the system or of an area on the system performance
14.    Impact of power contract transactions on the system performance applying grid code limits
15.    Application of load forecast for Luzon in the coming years and determine needed generation and transmission expansion

There might be other applicable analysis depending on the capability of the software being used, in this case Powerworld.  Thus, the list above is not exhaustive.