Search This Blog

Thursday, December 27, 2012

Voltage Stability Impact of Electric Vehicles

Reactive power consumption or injection is a promising feature out of electric vehicle charging. In [1] and [2], the authors present the analysis of the  reactive power control capability of an electric vehicle charging system to support the power system. Reactive power support and economics from the electric vehicles were discussed in references [3] and [4].

The electric vehicle charger follows the modes of operation [1]:

Electric vehicle charger operating modes [1].

Given these modes, analyzing power system voltage stability with electric vehicle charging would be needed. PV and QV curves will be helpful to assess the impact of the different charger operating modes as well as transient voltage stability simulations. This would be a welcome addition to the increasing literature of vehicle to grid (V2G) especially when the grid operator coordinates a large fleet of electric vehicle with the power network.

Does the electric vehicle charging mode provide increased power transfer in terms of static voltage stability? Does the operating mode of an electric vehicle charger gives a better voltage recovery during transient periods?

These research questions can be analyzed by modeling electric vehicle charging operating modes integrated in a power system test case.

References:

  1. M. Kisacikoglu, B. Ozpineci, L. M. Tolbert, "V2G Reactive Power Compensation Using a PHEV Bidirectional Charger Interface Rated at Level 1, 2, and 3 Charging Standards," IEEE Energy Conversion Congress and Exposition, Atlanta, Georgia, Sept. 12-16, 2010.
  2. M. Kisacikoglu, B. Ozpineci, L. M. Tolbert, "Examination of a PHEV Bidirectional Charger System for V2G Reactive Power Compensation," IEEE Applied Power Electronics Conference, Palm Springs, California, Feb. 21-25, 2010, pp. 458-465.
  3. Chenye Wu, Hamed Mohsenian-Rad, and Jianwei Huang, “PEV-based Reactive Power Compensation for Wind DG Units: A Stackelberg Game Approach”, in Proc. of the IEEE Conference on Smart Grid Communications (SmartGridComm’12), Tainan City, Taiwan, October 2012.
  4. Chenye Wu, Hamed Mohsenian-Rad, Jianwei Huang, Juri Jatskevich, PEV-Based Combined Frequency and Voltage Regulation for Smart Grid, the 3rd IEEE Innovative Smart Grid Technologies Conference, Washington DC, Jan 2012.

Thursday, December 13, 2012

E-Trikes and WESM


Using the 12-12-12 data from WESM, I plotted here the Luzon demand and Luzon LWAP with the inclusion of E-Trike. The peak load for this day was 7,191.7 MW (2 pm) and the lowest LWAP was P1,690.43 per MWh (4 am). For this day, the highest LWAP (P13,145.7/MWh at 6 pm) does not coincide with the peak load.

E-Trikes and WESM.

In the chosen scenario, the 100,000 E-Trikes will be aggregated and charged as one bulk load, but on the other hand, will take advantage of the LWAP at its lowest and be coordinated when the system demand is also at its lowest (off-peak) both from 3 am to 5 am.

Though the 100,000 E-Trikes are envisioned to hit the streets by 2017, it is necessary to study a "what-if" condition on whether the present generation capacity, at least in Luzon, will be able to accommodate the new 493 MW load of E-Trikes. From the NGCP website, the system capacity is 8,091 MW with peak load of 7,318 MW so that's why we have a generation reserve of 773 MW. If the charging of E-Trike is not done during the low load and low LWAP hours, the 493 MW of E-Trike will be added to the current peak load which will bring down the generation reserve to about 280 MW. If the largest contingency is more than 280 MW, the system will be operated at “Alert State”. This shows how important the timing of the E-Trikes’ charging when aggregated as one bulk load. Though when added as a load in the system, the E-Trikes as a load may impact the system price not as depicted in the graph.

The strategy of handling E-Trikes as an additional aggregated load in the power grid would be:

  • Charge when the LWAP is at its lowest – from economic standpoint, it makes sense. The E-Trike aggregator will enjoy economic benefits rather than utilizing uncoordinated charging related with LWAP which is to charge at random during a given day.
  • Charge when the demand is lowest – from generation capacity and system reliability viewpoints, this will provide support to the power system. Coordination of the E-Trike load with the demand curve may delay the need for additional generation capacity or investments.

In reality, some E-Trikes will be on the streets throughout the day/night. There are transportation needs to be met at night and any time during the day especially in urban locations so it is unlikely there will be 100,000 E-Trikes charging at the same time.

What is discussed here is a worst-case-what-if scenario which may allow us to think if the present generation capacity may be able to accommodate such 493 MW of E-Trike load. So as long as the bulk load does not plug into the grid during peak hours, economic and technical benefits are achievable.

Thursday, December 6, 2012

Benefits from Electric Vehicles for the Philippine Power Grid


The last blogs I posted on electric vehicles (EV) may seem to have created the wrong impression in what I’m trying to do. I analyzed the loading impacts of E-Jeepneys and E-Trike to local electric distribution power system, specifically loading up a pole mounted distribution transformer. In practice, these scenarios are very real and can be prevented by planning and coordinating new loads which are the EVs under the government’s program.

The overloading of electrical equipment, at least locally, is just one tiny bit on one side of the fence. EVs when largely manufactured and utilized can be a resource of power grid reliability and security support, just like any other ancillary services.

References [1-4] provide simulations and analysis on the following:
  • Frequency regulation – NGCP procures frequency regulation from on-line generators which are called spinning reserves. A big bulk of load can be aggregated and adjust accordingly to maintain system frequency, like a spinning generating reserve. I posted that the vision of DOE to have 100,000 E-Trikes by 2017 will have a MW load greater than the Quezon Power plant which is 480 MW. EV charging is via power electronic converters/inverters which are controllable. The charging of E-Trikes if coordinated accordingly to serve a load serving as a spinning reserve is a promising capability for E-Trikes or any large scale electric vehicle when aggregated.
  • Reactive power compensation – Again, NGCP installs and may procure voltage support services from generation or invest on its own reactive power devices. In [3], the authors described an EV charging system which can be a source of reactive power compensation. This system is allowed to inject or consume reactive power whichever is needed by the power system in real time. In [4], the authors provided a pricing methodology for wind farm reactive compensation provided by an EV charging park.
  • Contribution to system security – NGCP procures contingency reserves per Philippine Grid Code.  These are generators which are on-line ready to respond (increase or decrease their output) in times of a system disturbance. Authors in reference [2] indicate that EV chargers have response time faster than generators. In this case, going back to the 100,000 E-Trike, you may have a large “generator” providing that contingency reserve to mitigate any undesirable system condition due to a disturbance.
For large scale E-Trike or E-Jeepney charging, which is envisioned in the Philippines, these features would become income generating resources for EV operators or aggregators. Also, the NGCP will have another source of ancillary services which can be counted upon to support grid reliability and security.

References:
[1]    Chenye Wu, Hamed Mohsenian-Rad, Jianwei Huang, Juri Jatskevich, “PEV-Based Combined Frequency and Voltage Regulation for Smart Grid”, in Proc. of the IEEE PES Innovative Smart Grid Technologies Conference (ISGT’2012), Washington, DC, January 2012.
[2]    Sakis Meliopoulos, Jerome Meisel, George Cokkinides and Thomas Overbye, "Power System Level Impacts of Plug-In Hybrid Vehicles." PSERC Document 09-12, PSERC Final Report. October 2009.
[3]    M. Kisacikoglu, B. Ozpineci, L. M. Tolbert, "Examination of a PHEV Bidirectional Charger System for V2G Reactive Power Compensation," IEEE Applied Power Electronics Conference, Palm Springs, California, Feb. 21-25, 2010, pp. 458-465.
[4]    Chenye Wu, Hamed Mohsenian-Rad, and Jianwei Huang, “PEV-based Reactive Power Compensation for Wind DG Units: A Stackelberg Game Approach”, accepted for publication in Proc. of the IEEE Conference on Smart Grid Communications (SmartGridComm’12), Tainan City, Taiwan, October 2012.

Wednesday, December 5, 2012

E-Trike: Impact on Distribution Transformer Loading


The partnership of DOE and ADB envisions having 100,000 E-Trikes between now and 2017 [1]. Each E-Trike will have about 3 kW to 5 kW electric power usage and will be charging for about 45 minutes to 1 hour.

A study by DOE in collaboration with United Nations [2] indicated that one E-Trike will consume 1.8 MWh in one year. So to check the values here: 1.8 MWh divided by 365 days, an E-Trike will take 4.93 kWh. Below is a table for the kW loading of E-Trike(s). Note that 100,000 E-Trikes is even above the capacity of Quezon Power plant which has 480 MW capacity.


In this post, several scenarios of charging time and number of E-Trikes are presented using 4.93 kW charging power.

Figure 1 presents the connection of 1 E-Trike during three separate hours in the evening versus a 25 kVA distribution transformer. In here, the assumption is the E-Trike driver uses the vehicle from 8am to 5pm, then comes home to his family and charges his vehicle on those random hours. If 1 E-Trike is being connected with the base residential load curve, the 25 kVA distribution transformer will have no overloading.

Figure 1
Figure 2

Figure 2 shows the plots of several number of E-Trike being charged on separate hours of the day. For this case, the assumption is the E-Trike operator/businessman who has several vehicles takes advantage his vehicle charging according to the Time of Use (TOU) rates of the distribution utility. He may utilize a timer-switch to program when the charging begins and ends.  A 25 kVA distribution transformer will overload for the assumed hours for both during evening and during morning except for 3 E-Trikes during morning. A distribution utility coordination with this E-Trike operator will identify that an upgrade from 25 kVA to 37.5 kVA transformer will provide mitigation of the overload unless other households in the service area will shut down all their appliances ( voluntary load shedding).

References:

[1] Consultants sought for $500-M e-Trike project. Available: 
http://business.inquirer.net/74917/consultants-sought-for-500-m-e-trike-project
[2] Philippine Electric Vehicle Project. Available: http://cdm.unfccc.int/filestorage/3/K/Y/3KY4J2IW70AZPTX9MS6VGU1QORNE8F/Etrike%20CPA-DD%20ver1.pdf?t=MGF8bWVremlifDCLzXH3EtuSp9elyiR5MR_6

Revision on Loading Impacts of PHUV – E-Jeepney


Ms. Diana Limjoco, manufacturer of E-vehicles in the Philippines responded to my query and corrected my post on charging time of one E-Jeepney which I assumed to be 8 hours. According to her, an E-Jeepney can be charged fully at about 4-5 hours if done right.

Below, I updated the graphs for the loading impact of E-Jeepney(s) charging from 8 hours to 5 hours. No matter what the charging time is, a 25 kVA distribution transformer will suffer overloading for 1 PHUV scenario when charged during the evening and will be heavily loaded in other scenarios. If 2 PHUVs are charged at the same time, the 25 kVA distribution transformer will have severe overloads. And even if the transformer is rated 37.5 kVA, 2 PHUV charging at the same time will overload the transformer when combined with the base residential load.


In this case, the distribution utility has to be proactive in their operations planning in upgrading their distribution transformers or coordinate with consumers who have E-Jeepneys so as to prevent overloading of electrical equipment especially distribution transformers.

Tuesday, December 4, 2012

Loading Impacts of PHUV Electric Jeepney

It is interesting that while the US is looking into the impact of PHEVs on the existing electric grid infrastructure, the Philippines is producing it's own electric vehicles.

http://electric-vehicles-philippines.blogspot.com is a website detailing most of these products. From E-Jeepneys, electric motorcycles and electric tricycles or electric taxicles, they have it all.

Figure 1. PHUV Electric Jeepney (from http://electric-vehicles-philippines.blogspot.com/2010/04/phuv-electric-jeepney.html)

Though IEEE literature have investigated the impact of PHEVS on distribution transformer loading [1-3], Philippine electric vehicles are very different from the studied PHEVs. No literature have studied the local and global effects of these electric vehicles on the Philippine electric power systems.

In this post, loading impact of charging a PHUV Electric Jeepney on a given distribution transformer. Normally, a distribution transformer serves about five to seven households. A typical load curve is provided in Figure 1, taken from reference 4. The load curve is given in MW and was scaled down to kW. The figure also includes capacities of a 25 kVA and a 37.5 kVA distribution transformers. In the figure, neither of the transformer is overloaded.

Figure 2. Typical residential load curve.

From [5], the PHUV Electric Jeepney charging process is provided:
"PHUV batteries amp hour capacity rating is 220 amp hrs. Since they have a 72 volt system, they have 12 pcs of 6 volt deep cycle batteries. That's 16000 watt hours or 16 kilowatt hours at P8 per kwhour (Meralco rate with all the side charges) is equal to P128 or $2.8 per 8 hour full charge. So if it runs for 65 kms then that's 1.97 per km or 5 US cents per km."
To check the calculation, P = V x I ( P = 72 x 220 = 15,840 watts) . Converting it to kW, P = 15.84 kW which is fully charged for 8 hours. Note that 15.84 kW is above half of a 25 kVA transformer capacity and about 42% loading a 37.5 kVA transformer.

Assuming that the PHUV is utilized for public transport from 8am to 5pm, to integrate the PHUV into the load curve above, three scenarios are studied: (1) charge the PHUV from 6 pm to 2 am, (2) charge the PHUV from 1 am to 8 am, and (3) charge the PHUV from 11 pm to 7 am.

Figure 3 shows the load curve with an additional one (1) PHUV charging considering the three charging scenarios cited above. From the figure, a 25 kVA transformer will overload for charging scenario (1) and will be heavily loaded for the other scenarios.

Figure 3. Residential load curve with 1 PHUV charging.
Figure 4 shows the load curve with an additional two (2) PHUV charging considering the three charging scenarios cited above. From the figure, a 25 kVA transformer will be heavily overloaded for all charging scenarios and even the 37.5 kVA distribution transformer will overload for all charging scenarios.

Figure 4. Residential load curve with 2 PHUV charging.
Electric vehicles are good for the environment and will provide a boost in the Philippine economy since they are locally made. However, it is imperative to look into the loading impact of electric vehicles since they will provide distribution transformer overloading if not investigated.

Further analysis will include additional charging scenarios of electric motorcycles and electric tricycles in the mix. Also, a global outlook analysis is needed if the Philippine power grid as a whole can handle the forecasted usage of electric vehicles in the country.

References:
  1. Shao, Shengnan; Zhang, Tianshu; Pipattanasomporn, Manisa; Rahman, Saifur; , "Impact of TOU rates on distribution load shapes in a smart grid with PHEV penetration," Transmission and Distribution Conference and Exposition, 2010 IEEE PES, 19-22 April 2010
  2.  S. Shao, M. Pipattanasomporn and S. Rahman, "Demand Response as a Load Shaping Tool in an Intelligent Grid with Electric Vehicles”, IEEE Transactions on Smart Grid, vol. 2, No. 4, December 2011, pp. 624-631. 
  3.  S. Shao, M. Pipattanasomporn, and S. Rahman,"Challenges of PHEV Penetration to the Residential Distribution Network,"  IEEE/PES 2009 General Meeting, Power & Energy Society General Meeting, 2009. PES '09. IEEE, Calgary, AB, Canada,  July, 27th, 2009.
  4. Occidental Mindoro Electric Cooperative, Inc. Information Memorandum. Available: http://www.omeco.com.ph/files/pdf/OMECO%20INFORMATION%20MEMORANDUM.pdf
  5. PHUV Electric Jeepney - http://electric-vehicles-philippines.blogspot.com/2010/04/phuv-electric-jeepney.html

Thursday, November 29, 2012

Dynamic Models and Simulations for Reduced and Approximate Philippine Major Island Power Grids

Since developing the power flow models of Luzon, Visayas and Mindanao, one step forward in these projects is to provide dynamic modeling of the generators, exciters, governors, etc.

I followed the references [1-3] for assuming models for each generation considering fuel types. Also, combined with these good sources, PowerWorld provides default data for the dynamic models including the generic wind generation dynamic models (for NorthWind generation, north of Luzon) and loads (motors and discharge lighting, etc).

For generation using diesel as fuel, I initially modeled the machine as GENSAL but WECC has indicated to use GENTPJ instead for reasons cited in reference [4].

As I'm using PowerWorld, I made advantage of the auto correction of dynamic data and proceeded with the validation of models.

As mentioned in other posts, I simulated flat runs and had the models respond as expected. The following plots are simulated three-phase faults where fault clearing time is in accordance with the Philippine Grid Code and assuming a single-line contingency.

Bus Voltages Plots for Fault on Balintawak 230 kV, tripping Balintawak-Araneta 230 kV Line (Luzon)

Rotor Angles Plots for Fault on Balintawak 230 kV bus, tripping Balintawak-Araneta 230 kV Line (Luzon)

Bus Frequency Plots for Fault on Lugait 138 kV bus, tripping Lugait - Tagaloan 138 kV Line (Mindanao)

Generator Speed Plots for Fault on Lugait 138 kV bus, tripping Lugait - Tagaloan 138 kV Line (Mindanao)

Various Plots for Fault at Quiot 138 kV bus, tripping Quiot-Banilad 138 kV Line (Visayas)

I'm planning to write a full paper on this work and if you are interested in the models or collaborate with me, drop me a message at ebcano@gmail.com.

References:
[1]    IEEE Recommended Practice for Excitation System Models for Power System Stability Studies, IEEE Std 421.5-1992
[2]    IEEE PES Working Group, Hydraulic Turbine and Turbine Control Models for System Dynamic, IEEE Transaction on Power System 7 (1992) 167-174.
[3]    Dynamic Models Package Standard 1. Available: http://www.energy.siemens.com/hq/pool/hq/services/power-transmission-distribution/power-technologies-international/software-solutions/Dynamic_Models_Package_Standard-1.pdf
[4]    Additional Information on GENTPJ Model. Available: http://www.wecc.biz/library/WECC%20Documents/Documents%20for%20Generators/Generator%20Testing%20Program/gentpj%20and%20gensal%20morel.pdf

Monday, November 26, 2012

Modeling FACTS Devices


There are two categories in modeling Flexible AC Transmission System (FACTS) devices in power systems: steady –state modeling and dynamic modeling.

Steady-state

For Unified Power flow Controller (UPFC), you can model this device by inserting a phase shifting transformer (PAR) between two buses connected with a transmission line(s). Since a PAR controls the power transfer by adjusting its tap, this can mimic UPFC response in a given condition. Other implementation [1] includes a bus with a generator and a bus with a load, which are not connected, inserted in a transmission line where the power flow is supposedly controlled.

For a Static Var Compensator (SVC), model a generator without MW output but with MVar (Qmax and Qmin) limits. The model is basically a synchronous condenser but enough to simulate the SVC response. Normally, the output of the SVC is dependent on the bus voltage where it is connected (maintaining a certain magnitude).

For a Thyristor Controlled Static Reactor/Capacitor (TCSR/TCSC), model a series reactor/capacitor along a given transmission line in the power flow case. Note that this is basically a series compensation model and in power flow, the compensation is seen as constant in all throughout the simulation.

In any case, you must assure that no pre-contingency impact violation is produced when you add a FACTS device in the power flow model before running contingency analysis, OPF or locational marginal pricing (LMP) studies.

Dynamics

For SVC, most power system application programs (PSS/E, PSLF, and PowerWorld) apply a Static Var Compensator dynamic model (CSVGN), for example in PowerWorld [2].

For UPFC and TCSR/TCSC, for the above software packages there is no known modeling for dynamic simulations, unless a user model is developed. Most research on dynamic modeling of these devices are implemented in MATLAB or PSCAD/EMTDC.

References:
[1]    A. Kazemi, et al, “A comprehensive load flow model for UPFC and its combination with ESS.” Available: http://www.emo.org.tr/ekler/986405e39c5a796_ek.pdf
[2]   http://www.powerworld.com/files/Block-Diagrams.pdf

Wednesday, November 21, 2012

New Citations


Citing my work on “Utilizing Fuzzy Optimization for Distributed Generation Allocation,” IEEE TENCON 2007:

Citing my work on ““Static Voltage Stability Analysis for Electric Subtransmission System”, http://ebcano.files.wordpress.com/2008/07/microsoft-word-ebcano_vs_0908.pdf, 2008:


Tuesday, November 20, 2012

Reduced and Approximate Models of Philippine Major Island Power Grids


Abstract—The restructuring of electric power industry brings challenges and opportunities among its stakeholders. Economic and engineering analyses brought forth by these changes are usually tested on power system test models to study different strategies. In a developing country, like the Philippines, where commercial and security concerns may prevent the availability of these test systems, the involvement of research and academic communities’ maybe limited. This paper reports the development of reduced and approximate power system models for major islands in the Philippines using publicly available data which can be utilized for research and academic purposes.

Index Terms—Electric power test systems, interconnected power systems, electric power system modeling.

Download the full paper here.

Sunday, November 11, 2012

Integrating Computer Simulations in Electrical Engineering Courses


Abstract— At the deregulation of electric power industry, technical and value-based studies for planning and operations of power systems as outlined in electricity regulatory codes should be integrated in electrical engineering programs and promote the present scenario by undertaking power systems applications and incorporate computer simulations to stimulate students' interest and increase their insights with the on-going deregulation of the industry.  This paper provides experience of incorporating computer applications and simulations in undergraduate and graduate programs considering present curriculum and subject offerings. 

Index Terms— electrical engineering education, computer simulations, power systems

Download the full paper here.

Friday, November 2, 2012

New England 39 Bus Test System

The New England 39 bus test system is a power system test system usually utilized for dynamic simulations test and research. It is believed that this is an actual equivalent system of the New England grid in 1960s [1].


The data I utilized here comes from [2], where the power flow and dynamics data were given in PSS/E v29 format which were loaded into PowerWorld. The data has 1 kV base voltage in all buses which I changed to 345 kV to reflect the New England system voltages. In the PowerWorld's transient stability data validation (this is very cool!), I accepted the corrections identified in the dynamic data, mostly are time constant depending on the time step being studied.

Normally in stability simulations, it is imperative to run a no fault simulation or what they call flat run to verify that dynamic models are behaving in a manner without disturbance thus expecting flat plots of parameters.

Generator angles for no fault simulation.

A stub fault is another practical test if the response of the dynamic models is correct for a simple and fast fault disturbance. Here are example plots from a stub fault at bus 1 at 1.0 seconds and cleared after 0.1 seconds without tripping any line.

Generator angles for stub fault simulation.

Generator speed for stub fault simulation.

Bus frequency for stub fault simulation.

Bus voltages for stub fault simulation.

If you want the New England 39 bus test system, email me at ebcano@gmail.com.

References:
[1] Power Systems Test Case Archive. Available on-line: http://www.ee.washington.edu/research/pstca/dyn30/pg_tcadyn30.htm
[2] Pablo Ledesma, New England Test System, IEEE 39 Bus System, 10 generators, in PSS/E format (version 29). Departamento de Ingeniería Eléctrica Universidad Carlos III de Madrid. Available on-line: http://electrica.uc3m.es/pablole/new_england.html


Thursday, October 18, 2012

Cost Allocation of SPS Service Using Cooperative Game Theory


Power systems planning and operations are usually defined by N-1 criterion. This means that in an event of a single contingency, no remaining connected transmission elements will be thermally overloaded, no bus voltage will be outside of acceptable limits, no system interface limit is violated, and system stability is maintained.

Special Protection Systems or SPS are widely utilized for increasing power transfer in transmission systems at the same time respecting security constraints [1]. SPS applications usually are generation rejection schemes (GRS), line/transformer transfer tripping and load shedding. GRS are designed to mitigate overloading of a transmission line or lines after an N-1 contingency near the vicinity of a generating plant or are employed to arrest increasing dynamic oscillation which may lead to unstable system conditions. Without the GRS, generation output is curtailed to satisfy the N-1 security criterion. With the GRS, the output of the generation is increased thereby increasing power transfer. Further, GRS also mitigates or delays the possibility of transmission expansion or investment due to transmission capacity constraints.

In a locational marginal pricing based electricity market, curtailment of generation (without GRS), specifically of a cheap generation due to the security N-1 criterion can be considered as transmission congestion. Transmission capacity limitations impede the generation output thereby decreasing the profit opportunity of the generation company (GenCo).  If a GRS is installed for this GenCo, the output of the GenCo is increased and thus there is a clear benefit for the GenCo in terms of profit. When transfer capability is limited, without GRS, the profit of a transmission owner (TO) is decreased due to less power wheeling charges. With the GRS, wheeling charges increase as a consequence of the added power transfer. This premise is the same with the electricity system and market administrator, called independent system operator (ISO), since the ISO charges for cost-based services including scheduling, system control and dispatch.  For the demand side, when generation output is curtailed due to congestion, without GRS, the resulting nodal prices at the demand’s location maybe higher than when a GRS is in place to increase generation output from a cheap generation.

GRS installations have embedded cost and actual service cost [3]. Since electricity market participants have various benefits in having a GRS installation, the cost of the SPS/GRS service must be allocated among the participants. Cooperative game theory [4-5] can be utilized in allocating fair cost on the beneficiaries of the SPS service.
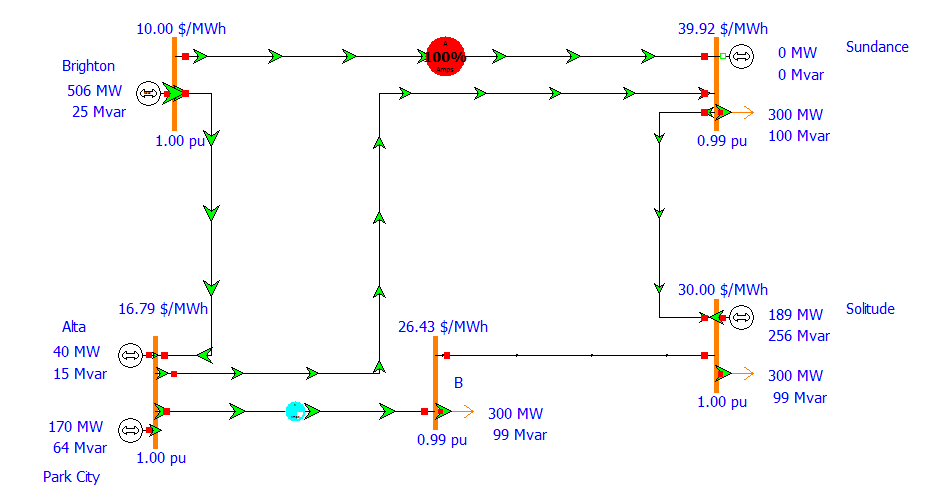
The PJM 5 bus test system [6], shown Figure 1, is to be utilized as an example for the application of cooperative game theory in sharing the SPS service cost among power system organizations.

Figure 1. PJM 5 bus test system.

References:
[1]     W. Fu, S. Zhao, J. D. McCalley, V. Vittal, N. Abi-Samra, “Risk Assessment for Special Protection Systems,” IEEE Transactions on Power Systems, vol. 17, no. 1, pp. 63-72. February 2002. Available: home.eng.iastate.edu/~JDM/WebJournalPapers/RiskAssessentSPS.pdf
[3]     J. K. Earle, “Functional unbundling of special protection systems as a required interconnected operating service in a deregulated environment,” MSEE Thesis, University of New Brunswick, 1997. Available: dspace.hil.unb.ca:8080/handle/1882/42522
[4]     H. Singh, “Introduction to Game Theory and Its Application in Electric Power Markets,” IEEE Computer Applications in Power, IEEE Computer Application in Power, vol.12, no.2, pp. 18-20, 22, Oct.1999.
[5]     J. Mepokee, D. Enke, B. Chowdhury, “Cost allocation for transmission investment using agent-based game theory,” International Conference on Probabilistic Methods Applied to Power Systems, Iowa State University, Ames, Iowa, September 12-16, 2004.
[6]     L. Fangxing, B. Rui, "Small Test Systems for Power System Economic Studies," Proceedings of the 2010 IEEE PES General Meeting, Minneapolis, MN, July 25-29, 2010.

Tuesday, September 25, 2012

Mindanao Approximate Grid Model

Here is your Mindanao Approximate Grid Model.


Mindanao Approximate Grid Model in PowerWorld


In coming up with the Mindanao model, I still followed the procedure I have developed in this post, with the following diversions:

  •  The transformers’ rating in this model are assumed, I can’t find any public information on the grid transformer ratings.
  •  The transmission lines’ ratings were assumed to be 100 MVA for the 69 kV lines, 215 MVA for the 138 kV lines (consistent with the Visayas modeling) and 300 MVA for the 230 kV lines.
  •  There is no publicly available for demand allocation for the Mindanao model. For this approximate model, the load distribution was based on the population of each region (group of provinces) from this Wikipedia page (http://en.wikipedia.org/wiki/Mindanao). I started with having 1200 MW of load and partitioned it per percentage population where the load substations are located.
  •  The network configuration was derived using the following data rich public sources:


Again, this is an approximate model and does not attempt to replicate what NGCP or WESM is using and the model is developed for educational and research purposes. There is no publicly available Mindanao grid model to benchmark this approximate model.

Again, a big gigantic thanks to PowerWorld for the very user-friendly and very visually attractive tool.

You can download the Mindanao approximate network model here, if you bump into a dead link, please drop me an email.


Sunday, September 23, 2012

Kundur Two-Area Test System


Kundur's two-area test system, from Prabha Kundur's book "Power System Stability and Control", is a power system utilized mostly for testing dynamics of solving stability issues.  Most researchers and engineers worked on this system to analyzed HVDC and FACTS impact on the transient stability. Other works were focused on small signal stability effect of such devices and/or Power System Stabilizers (PSS).

Single-line diagram of the Kundur two-area system.

The left part of the system is Area 1 and right part is Area 2. The ties (lines between buses 7, 8 and 9) are 110 km long thus the interconnection is rather not strong.

The system has dynamic data for the four machines and their exciters and stabilizers, aside from the power flow data. I took the power flow and dynamics data from "Implementation of an Adaptive Controller for Controlled Series Compensators in PSS/E". I adjusted the tie lines' data since the paper indicates that the lines were 150 km.

I will probably post power system dynamics tests using this system in the upcoming months (impact of PSS, critical clearing times, etc.).

You can download the test system built on PowerWorld v16 using this link.

Thursday, September 13, 2012

PJM 5 Bus System


Yet, another test system.

Well, power system operations, planning and markets are tested on these systems. Before electricity market designs are put into production phase, they are tested on some test systems. One of the most popular test systems for economic studies is the PJM 5 bus system.

Mostly, studies on locational marginal pricing (LMP) and security constrained unit commitment or economic dispatch have been studied on this small system.

Two notable sources which detail the system’s characteristic and usage are the following:


Replicated the results of the constrained and unconstrained scenarios from the PJM website below. The unconstrained results show equal LMP across the system, while the constrained system provides higher level of demand and the transmission line limits cause the LMP to be different.

Unconstrained case.

Constrained case.


You can download the PJM 5 bus system here. Use PowerWorld to simulate the results and don’t forget to input for generation cost output model which I assumed it to be piecewise linear cost function and go to Case Information à OPF à Areas, under AGC status set to OPF. Under Run mode, do the Primal LP OPF solution to acquire the results.

Friday, September 7, 2012

Visayas Grid Approximate Model


I have developed the Visayas Grid approximate model using available public data following the procedure given in my approximate Luzon network model. For the Visayas model, I used the line parameters given in the book “Probabilistic Transmission Planning” as shown below.


The single-line diagram was posted previously at wesm.ph but not currently. Still, publicly, Nick Nichol’s website has it – link.

Again, this is approximate and does not attempt to replicate what NGCP or WESM is using. Nevertheless, this model can be utilized by electrical engineering instructors in teaching power systems, analysis and issues in the electric power industry. It can be useful for computer based laboratory exercises in power systems, transmission and distribution. It is useful for research for technical reports or thesis during senior year. If there are Filipino electrical engineering instructors open to discussing how to use this model, I am very willing to cooperate and we can do this via skype or google+.

Some notes on developing the Visayas grid model:
  • The Visayas submarine cables are an important components together with the shunt reactors. Precise modeling of these components is not attempted.
  • The nature of Visayas grid is that it is not a meshed power system but is a radial power system: from Leyte-Samar to Bohol and Cebu to Negros to Panay Island. This means power flow solution algorithm being used can be tricky unlike in meshed power systems like that of Luzon.
  • Validating this model can be cumbersome, apply generation MW/cost bid parameters from wesm.ph and see if the locational marginal prices of this model and that of posted at wesm.ph matches up. If you would like to cooperate on this, I am open to doing it in PowerWorld. 

I’m not connected to PowerWorld, nor I’m endorsing it. It’s just that I am using it and because PowerWorld has practical power system applications like power flow, contingency analysis, shift factor calculations, optimal power flow, security constrained optimal power flow, short circuit analysis, and transient stability just to name a few. 

If you have questions or want the model, drop me an email at ebcano@gmail.com. Or download the model here.


Friday, May 11, 2012

Averting The Predicted 2013 Power Crisis

Google this "Rowaldo Del Mundo".

Instantly, you read lines and lines of the upcoming power crisis in the Philippines. At least my title says "predicted". Just like the forecasted electric demand, the power crisis supposedly happening in 2013 is forecasted, too. It is uncertain. Though the numbers tell us the generation capacity is short by that time compared to the demand, not only investments in generation capacity will surely help.

WESM has been employing demand response control in Visayas which prove to be effective in peak shaving. Large customers who own their generation in their facility help out in alleviating the need to put up power plants, which take some time to build, when they voluntarily interrupt their grid connection and depend on their in-house energy sources. In this case, WESM may design a demand response program which can provide peak shaving for normal and emergency grid operations. This may delay the shortage generation from short to medium term. This will also lessen transmission congestion since local generation will supply local loads.

Second, it's time for WESM to design a installed generation capacity market. The spot market in energy brings competition in the short term which is good but it's short term and just pay for the variable cost of power plants. The variable cost covers fuel and operating expenses of putting out MW to the grid. In a capacity market, the market operator will provide signal for investors and reward payment for that fixed costs in building power plants.

Third, DOE must reward large customers who practice energy efficiency programs. Energy efficiency may not be significant in impacting the level of electricity demand, however, better than no action. Measure their consumption during peak hours and see if they are contributing to alleviate the generation shortage.

I hope to come back on this interesting topic by 2013 and see what happened and what did not happen. By that time, I will still use Google.